Why Are People Leaving Your Website in 2026? The Real Issues & Proven Fixes
Learn why people leave your website in 2026 and discover actionable solutions to fix high bounce rates, improve engagement, and retain more visitors.
 Written byPrithvi Jadwani
Table of contents
Summarize this article with AI
TL;DR
Your bounce rate is not an accident. It is a direct signal of infrastructure failures, channel mismatches, and UX friction points you can measure and fix. In 2026, the cross-industry median bounce rate sits at 47.4%, but the top quartile operates at 36.1%. The gap between those two numbers is revenue you are leaving on the table.
- Speed is the floor. Pages loading over 3 seconds see a 38% bounce rate increase. Fix speed first, then optimize content.
- Channel matters more than industry. Paid search bounces at 38.6%, display at 65%+. Segment before you benchmark or you are measuring noise.
- Mobile bounces 12 points higher structurally. Mobile sessions bounce at 51.8% vs 39.7% on desktop. Accept the gap and optimize from that baseline.
- Top quartile is the real benchmark. Aiming for the median is aiming to be average. The 36.1% bounce rate is where serious operators compete.
Understanding Website Bounce Rate in 2026: What the Numbers Tell Us
There are 1.4 billion websites on the internet right now. Only one in seven is actively maintained. That leaves 205 million live sites competing for the same pool of attention, and 252,000 new ones launching every single day.
Your bounce rate is the clearest signal of whether you are winning or losing that fight.
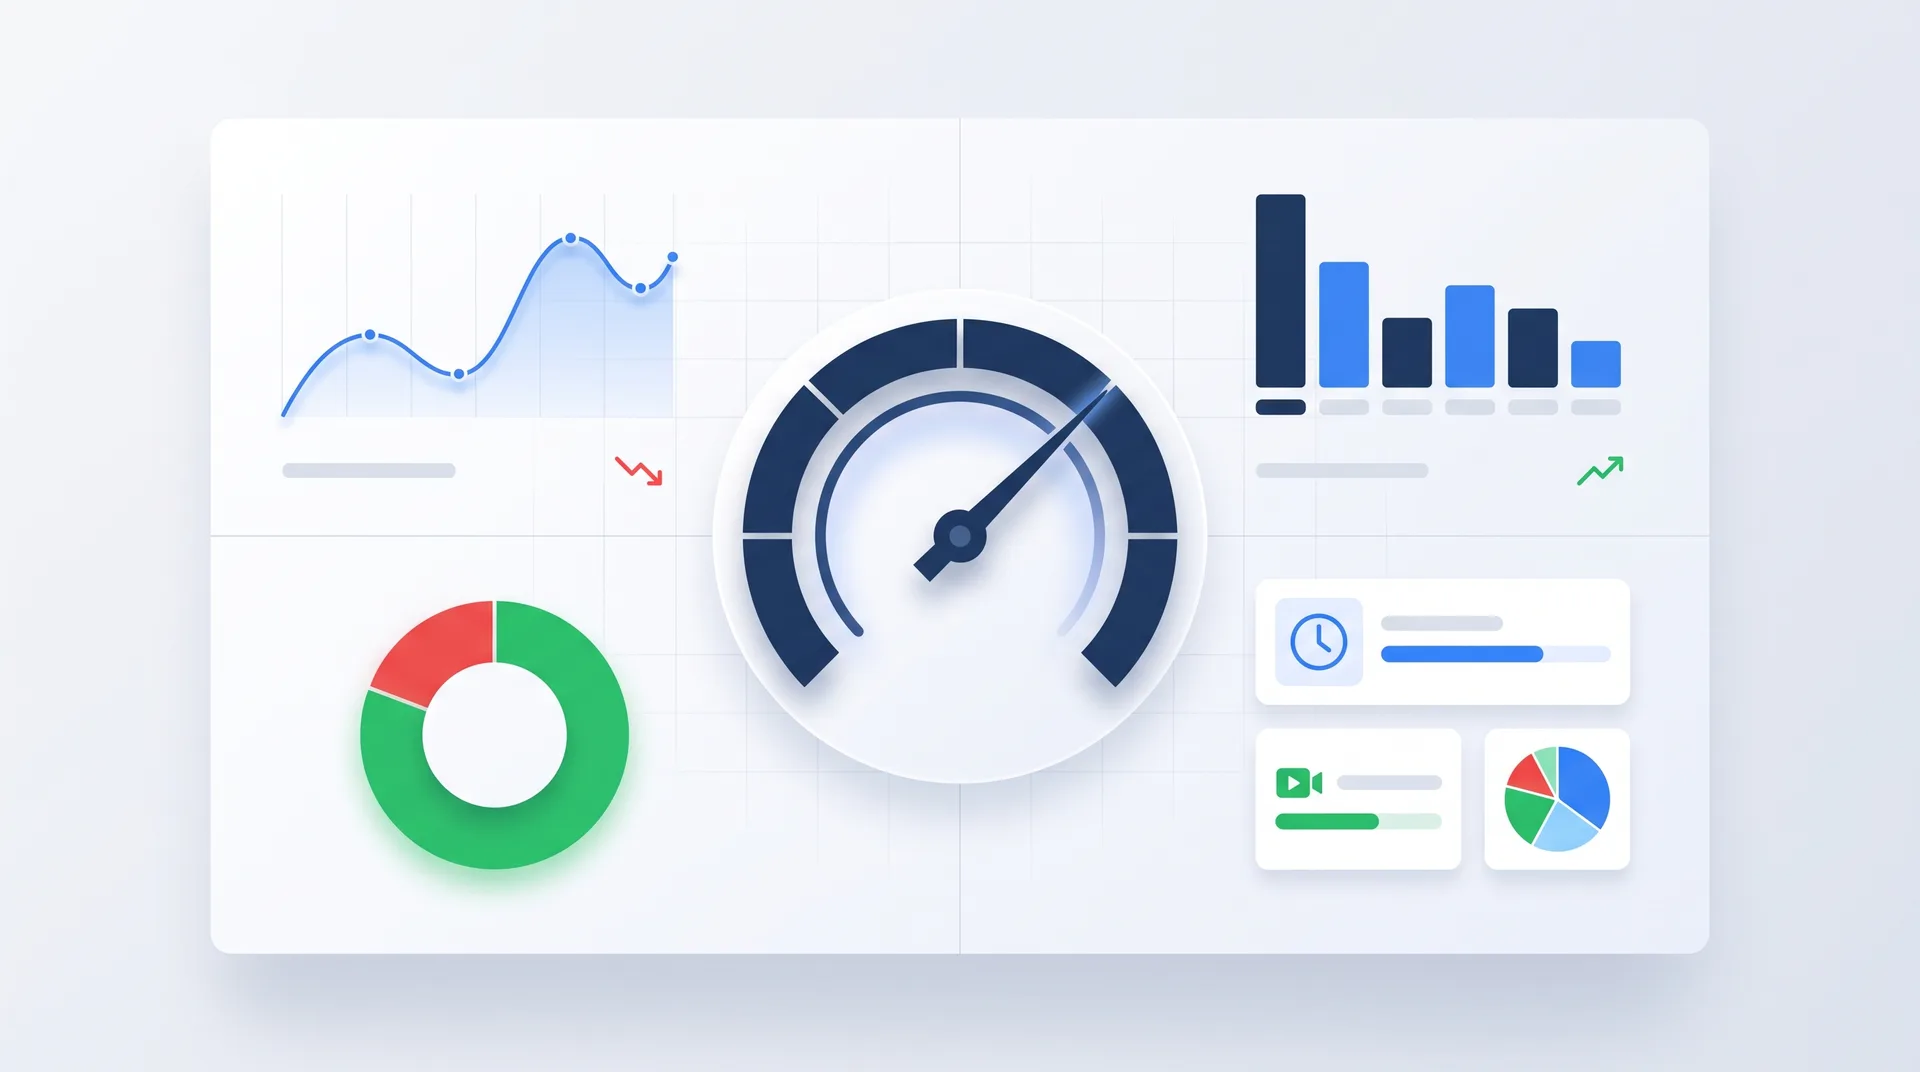
In 2026, a bounce is defined as a session lasting under 10 seconds with zero conversion events and zero secondary pageviews. The cross-industry median bounce rate is 47.4%. That means half of all sessions across the open web meet that definition. But here is the part most people miss: the median is not the target. The top quartile sits at 36.1%, and that is where serious operators measure themselves.
Mobile bounce rates run 12.1 percentage points higher than desktop: 51.8% versus 39.7%. That gap has not closed in three years despite mobile-first design becoming the default. The gap is not a bug. It is a property of the device.
The Page Speed Crisis: Why Load Time Is Your Biggest Enemy
47% of users expect a site to load in under 2 seconds. 40% will leave if it takes longer than 3 seconds. Those are not aspirational numbers. They are table stakes.
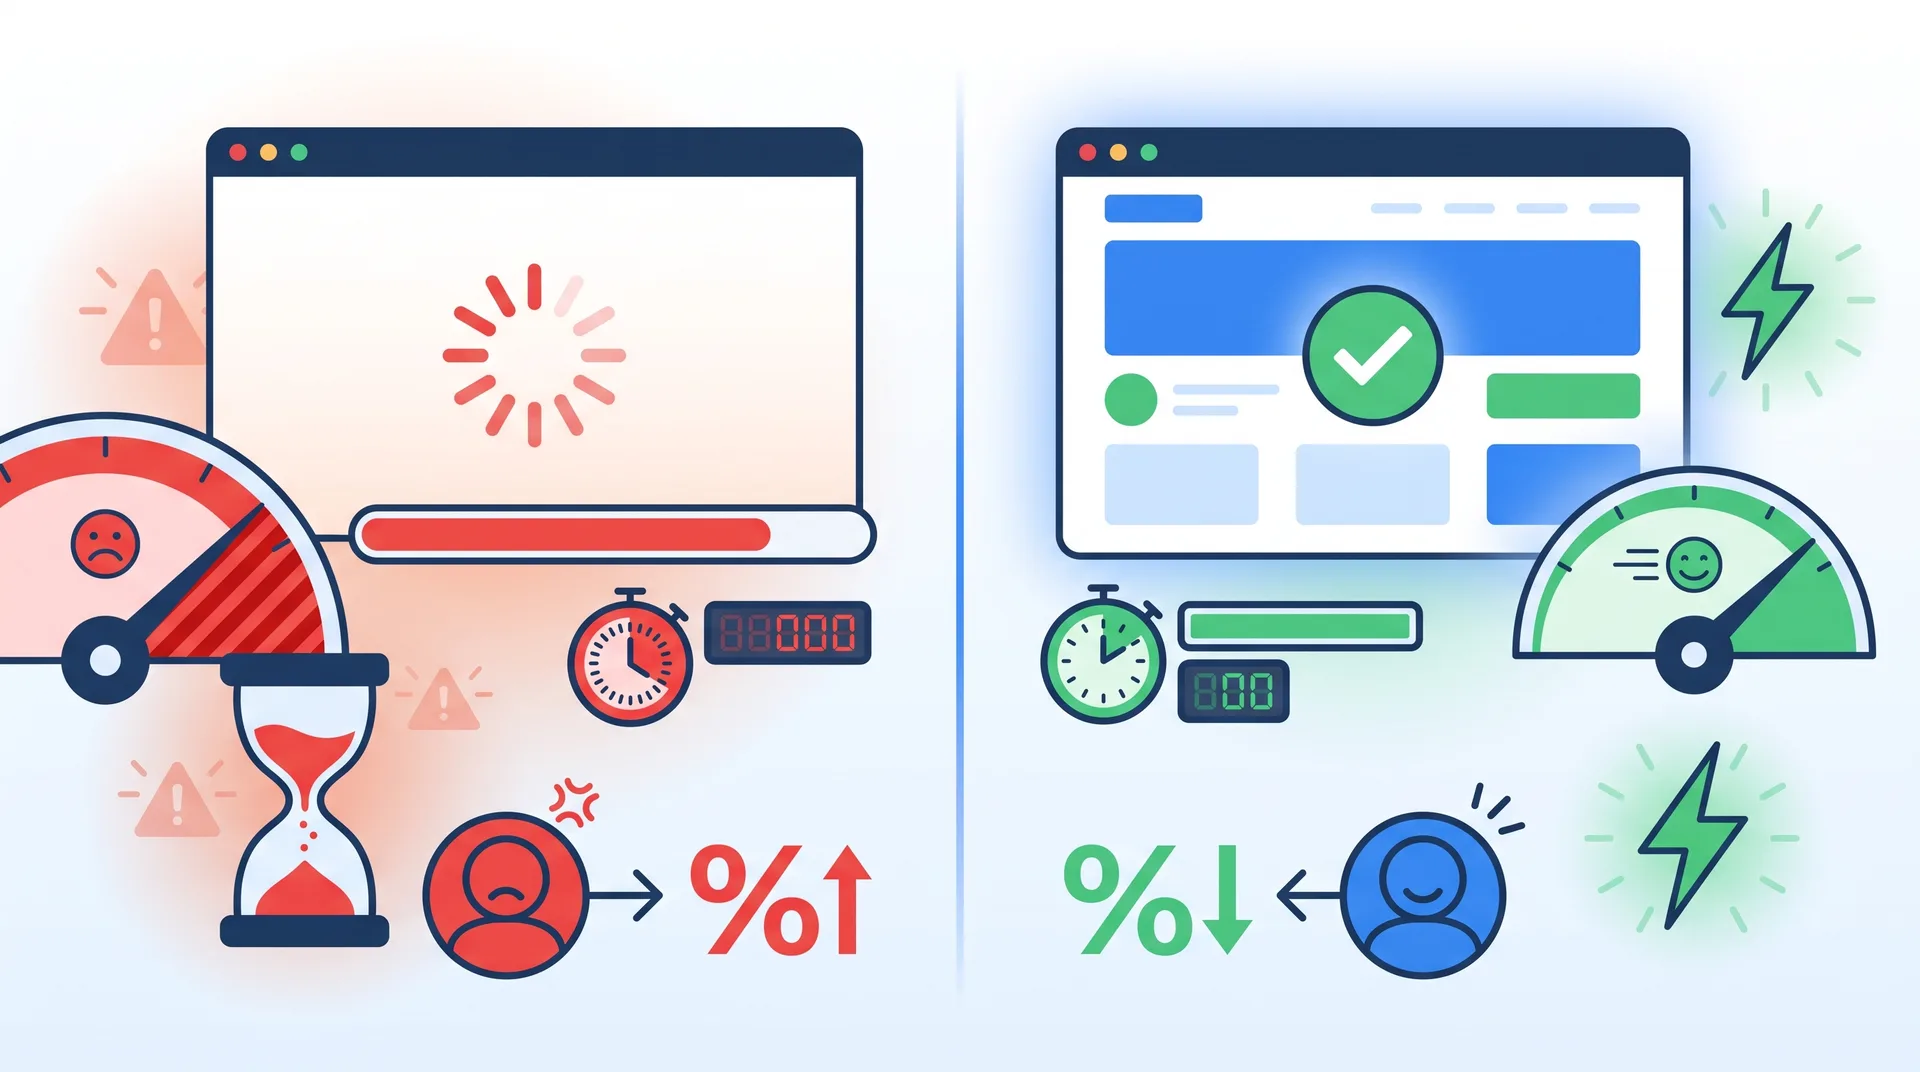
Here is what the data shows: sessions on pages loading in under 1 second bounce at 30.8%. Pages loading in 3 to 6 seconds bounce at 49.3%. Pages over 6 seconds bounce at 67.2%. The breakpoint is at 3 seconds. Below that threshold, content quality dominates the bounce decision. Above it, infrastructure becomes the limiter.
For sites with 3-second-plus median load times, no amount of copy work or design polish moves the needle until the speed problem is fixed. You cannot write your way out of a slow server.
Compress images using WebP or AVIF formats - most sites ship unoptimized PNGs that add 2+ seconds to load time
Use a CDN to serve static assets from edge locations closer to your users
Enable browser caching so returning visitors do not re-download the same resources
Minify CSS and JavaScript - every kilobyte counts when you are racing against the 3-second threshold
Lazy-load images below the fold so the critical content renders first
The Mobile Experience Gap: Why Your Mobile Visitors Are Leaving
Mobile sessions bounce at 51.8%. Desktop sessions bounce at 39.7%. That is a 12.1-point structural gap that has not moved in three years.
The gap is not a UX bug. It is a property of the device. Mobile users carry higher intent diversity: commute browsing, social referral curiosity, push notification taps. They also deal with variable connection quality that desktop users do not face. Optimizing mobile bounce means accepting the floor is higher than desktop and working from that baseline.
Pros
Desktop users have stable connections and larger screens for content consumption
Desktop sessions show lower intent diversity and higher pre-qualification
Desktop bounce rate baseline starts at 39.7%, giving more room to optimize
Cons
Mobile users face variable connection quality that impacts load times unpredictably
Mobile screens force more scrolling and interaction friction
Mobile sessions include high-distraction environments like commutes and multitasking
Mobile bounce rate baseline starts at 51.8%, requiring different optimization strategies
Most brands treat mobile optimization as a checkbox: responsive design, mobile-first CSS, touch-friendly buttons. But the gap persists because those changes address layout, not behavior.
Mobile-Specific Optimization Checklist
Test load time on 3G connections, not just WiFi - most users are not on fiber
Place your primary CTA above the fold without requiring any scroll
Use larger tap targets (minimum 48x48 pixels) to reduce mis-taps and frustration
Eliminate horizontal scrolling entirely - it breaks the mobile reading flow
Reduce form fields to the absolute minimum - every extra field increases mobile abandonment
Test on real devices, not just browser emulators - emulators miss connection variability
Traffic Source Matters More Than You Think: Channel-Specific Bounce Patterns
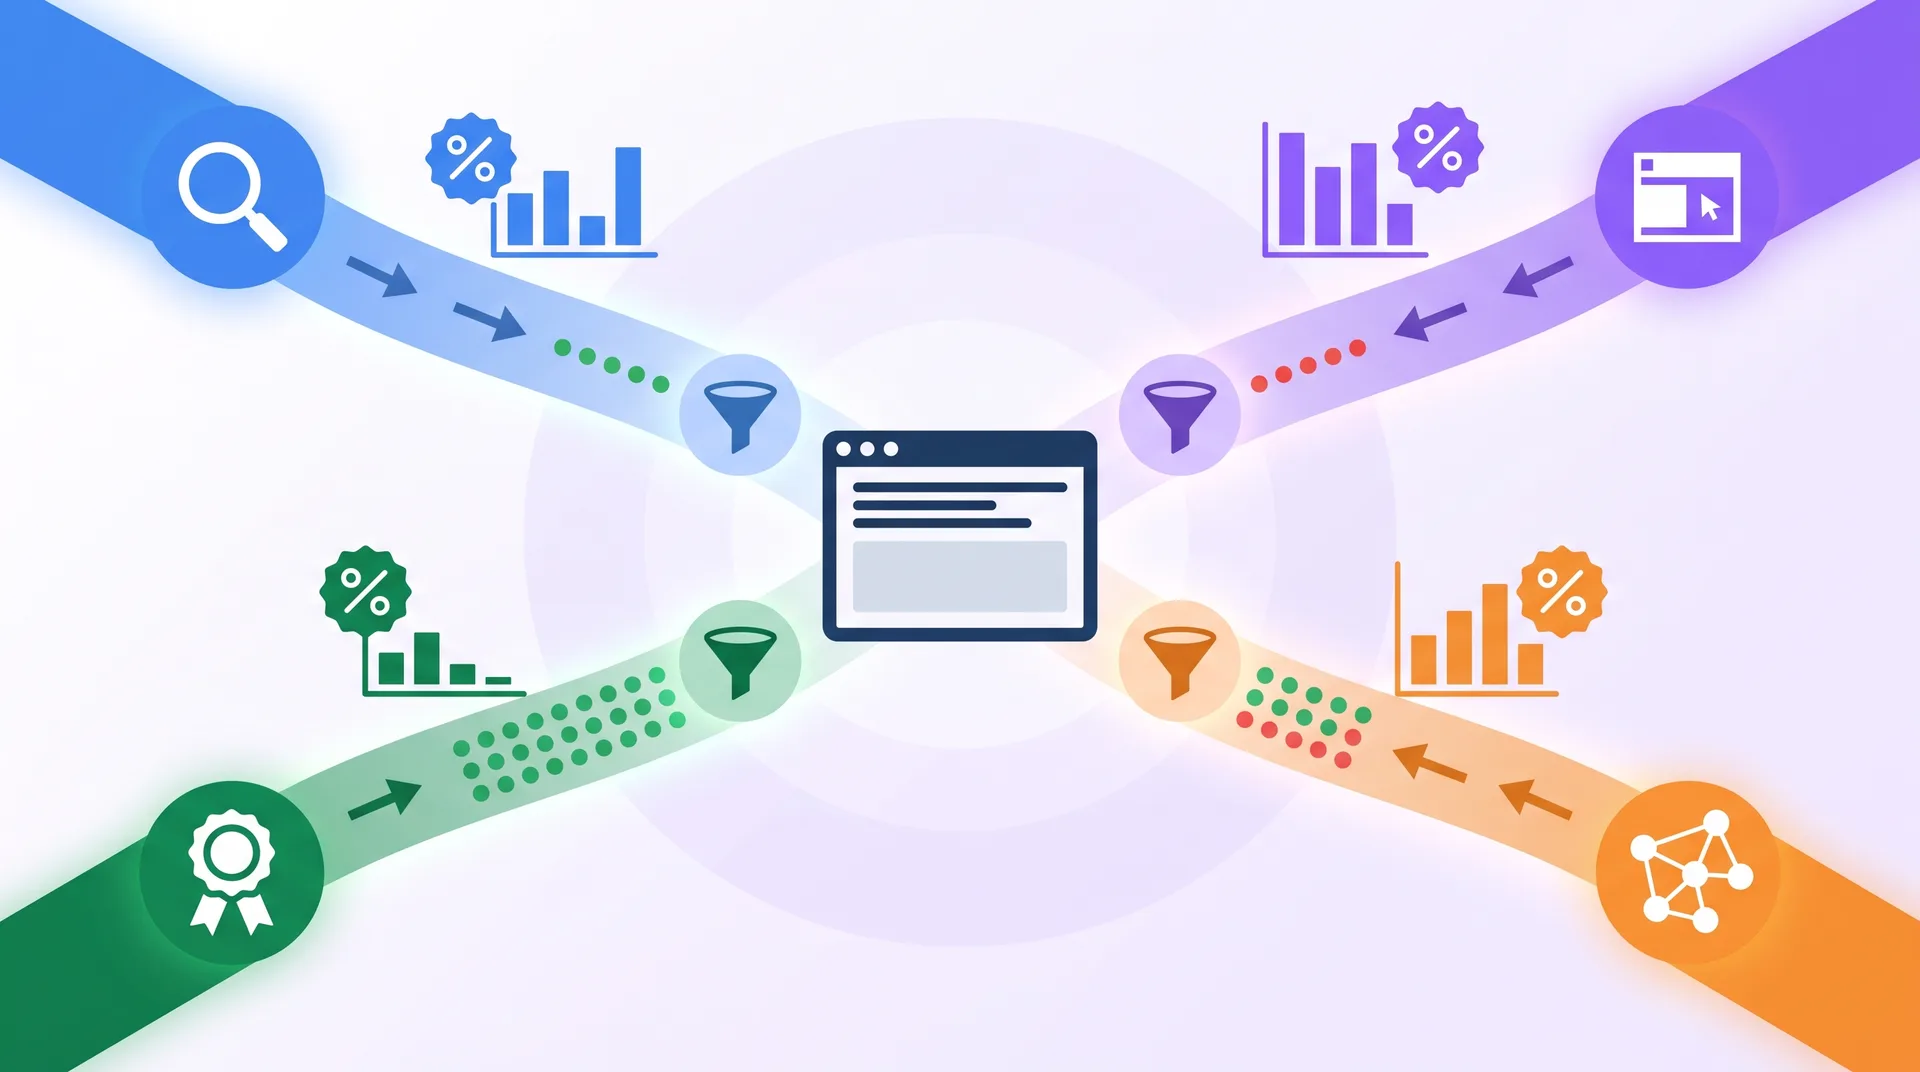
Paid search visitors bounce at 38.6%. Display visitors bounce at 65% or higher. Same site. Same content. Wildly different bounce rates.
Channel-level bounce rate variance exceeds industry-level variance across every sector. A blended bounce rate of 55% is meaningless without the channel breakdown. You could have healthy paid search performance masked by terrible display traffic, or vice versa.
Paid Search: 38.6% Bounce
Visitors arrive with explicit query intent. They typed something specific into Google and clicked your ad. Pre-qualified, high-intent, lower bounce.
Display Ads: 65%+ Bounce
Visitors arrive without intent. They were reading an article and saw your banner. No pre-qualification, curiosity clicks, much higher bounce.
Branded Traffic: 32.4% Bounce
Visitors searching your brand name already know who you are. Familiarity and pre-qualification drive the lowest bounce rates across all channels.
Informational Queries: 49.7% Bounce
Visitors arrive from long-tail informational searches. They are researching, not buying. A 50% bounce on top-of-funnel content is healthy.
Branded traffic bounces 17 points lower than informational queries: 32.4% versus 49.7%. The gap reflects familiarity and pre-qualification. For brands measuring SEO performance, this means weighting bounce by query type. A 50% bounce on informational top-of-funnel content is healthy. The same rate on a branded landing page indicates a UX or messaging problem.
Poor User Experience Design: The Silent Visitor Killer
Most sites lose visitors in the first 10 seconds because the UX creates friction before value is delivered. Confusing navigation. Cluttered layouts. No clear value proposition above the fold. Intrusive pop-ups that block content before anyone has decided they want to stay.
Here is what happens: a visitor lands on your page. They scan for two things in the first three seconds: Is this what I was looking for? and Can I find what I need quickly? If the answer to either question is no, they leave.
Navigation menus with too many options create decision paralysis - limit primary navigation to 5-7 items maximum
Lack of visual hierarchy makes it unclear where to look first - use size, color, and spacing to guide the eye
Pop-ups that appear within the first 5 seconds interrupt the evaluation process before visitors decide to engage
Non-responsive design that breaks on tablets or smaller screens sends a signal that you do not care about mobile users
Auto-playing videos with sound create immediate negative reactions and drive exits
Unclear CTAs that use vague language like 'Learn More' instead of specific action verbs
I have seen brands spend $50,000 on paid traffic and lose 70% of it to a homepage that takes 6 seconds to explain what the company does. The traffic was fine. The landing experience was not.
Common UX Mistakes That Drive Bounces
Why do visitors leave if the navigation is too complex?
Complex navigation creates cognitive load. When visitors cannot quickly identify where to go next, they default to leaving rather than spending mental energy figuring out your site structure. Limit primary navigation to 5-7 clear categories.
How do pop-ups impact bounce rate?
Pop-ups that appear in the first 5 seconds interrupt the evaluation process. Visitors have not yet decided if your site is worth their time. Interrupting them before they make that decision increases the likelihood they will leave. Delay pop-ups until after 30 seconds or after scroll depth indicates engagement.
What makes a landing page non-responsive?
A non-responsive page fails to adapt to different screen sizes. Text becomes unreadable, buttons become untappable, images overflow the viewport. On mobile, this creates immediate frustration. Test on real devices, not just browser emulators.
Why does lack of a clear value proposition drive bounces?
Visitors decide in 3 seconds whether your page answers their need. If your headline and subheadline do not immediately communicate what you do and why it matters, they will leave to find a site that does. Put your value proposition above the fold in plain language.
How does visual hierarchy affect bounce rate?
Without clear visual hierarchy, visitors do not know where to look first. Their eyes scan randomly, they miss the key information, and they leave. Use size, color, contrast, and whitespace to create a clear path through the content.
Content Mismatch: When Expectations Don't Meet Reality
Misleading titles and meta descriptions create expectation gaps. A visitor clicks because the search result promised one thing. They land on your page and find something else. They leave.
This is not about clickbait. It is about alignment. If your meta description says 'Step-by-step guide to fixing X' and your page is a 500-word overview with no steps, you have broken the promise. The visitor bounces, and Google logs that as a negative signal.
Content that does not match search intent causes immediate bounces. The visitor came looking for a specific answer. If your page does not deliver it in the first 10 seconds, they are gone.
Prithvi Jadwani, TechDevs SEO Strategy
Informational content bouncing at 49.7% is healthy. Those visitors are researching, not buying. But branded pages bouncing at that rate signal a problem. Someone searching your brand name already knows who you are. If they leave immediately, your messaging or UX is broken.
Content Alignment Checklist
Match your H1 to the search query intent - if they searched 'how to', your H1 should say 'How to'
Deliver the promised value above the fold - do not make visitors scroll to find the answer
Use scannable formatting: headings, bullet points, short paragraphs - walls of text drive bounces
Include a table of contents for long-form content so visitors can jump to the section they need
Test your meta descriptions against the actual page content - if they do not match, rewrite one or the other
I tested this on a client site last year. We rewrote 30 meta descriptions to match the actual page content more accurately. Bounce rate on those pages dropped 11 points in six weeks. Same content. Same design. Just better alignment between expectation and delivery.
Proven Solutions to Reduce Your Website Bounce Rate in 2026
Reducing bounce rate is not about tricks. It is about removing friction and delivering value faster than your competitors. Here is what actually works.
Tactical Fixes That Move the Needle
How do I optimize page speed to under 3 seconds?
Use a CDN to serve static assets from edge locations. Compress images using WebP or AVIF formats. Enable browser caching. Minify CSS and JavaScript. Lazy-load images below the fold. Test on real 3G connections, not just WiFi. If your page takes longer than 3 seconds to load, you are starting every session with a 38% higher bounce rate.
What mobile-specific UX improvements reduce bounce rate?
Place your primary CTA above the fold without requiring scroll. Use larger tap targets (minimum 48x48 pixels). Eliminate horizontal scrolling entirely. Reduce form fields to the absolute minimum. Test on real devices, not emulators. Accept that mobile bounce rates run 12 points higher structurally and optimize from that baseline.
How do I segment and optimize by traffic channel?
Break down bounce rate by source in GA4: paid search, display, organic, direct, social, referral. Set different goals for each channel. Aim for sub-40% on paid search. Accept 50%+ on display. Optimize landing pages specifically for the channel driving the traffic. A blended bounce rate hides the real problems.
How can I use AI to match content to visitor intent faster?
Use AI-powered personalization tools to dynamically adjust headlines, CTAs, and content blocks based on the referring query or traffic source. Show different messaging to paid search visitors versus organic visitors. Deliver the most relevant content in the first 10 seconds based on how they arrived. This reduces the expectation gap that drives bounces.
What makes content scannable enough to reduce bounce?
Use clear H2 and H3 headings that tell the story even if someone only reads those. Break paragraphs into 2-3 sentence blocks. Use bullet points for lists. Add a table of contents for long-form content. Highlight key takeaways with bold text or callout boxes. Most visitors scan before they read. Make scanning easy.
How do I A/B test CTAs and pop-ups to reduce friction?
Test pop-up timing: immediate versus 30 seconds versus scroll depth trigger. Test CTA copy: specific action verbs versus vague phrases like 'Learn More'. Test CTA placement: above the fold versus end of content. Run tests for at least two weeks to account for traffic variance. Measure bounce rate as the primary metric, not just clicks.
But here is the part most guides skip: you cannot optimize everything at once. Pick the biggest lever first.
Priority Order for Bounce Rate Optimization
Fix page speed first - if you are over 3 seconds, nothing else matters until this is resolved
Segment by channel and identify which sources have the worst bounce rates
Optimize mobile UX separately from desktop - different baselines require different strategies
Align meta descriptions and headlines with actual page content to close expectation gaps
Test CTA placement and pop-up timing to reduce friction points
Improve content scannability with headings, bullets, and visual hierarchy
Measuring Success: Setting Realistic Bounce Rate Goals for 2026
The median bounce rate is 47.4%. The top quartile is 36.1%. If you are aiming for the median, you are aiming to be average. That is not a strategy.
Set different goals for mobile versus desktop. Mobile sessions bounce at 51.8% baseline. Desktop sessions bounce at 39.7% baseline. A 45% mobile bounce rate is strong performance. A 45% desktop bounce rate is mediocre.
Segment goals by channel. Aim for sub-40% on paid search. Accept 50%+ on display. Weight bounce rates by query type: informational content bouncing at 50% is fine. Branded pages bouncing at 50% is a red flag.
Paid Search Goal
Target 35-38% bounce rate. High-intent traffic with explicit query intent should convert or engage at higher rates than other channels.
Organic Search Goal
Target 40-45% for branded queries, 48-52% for informational queries. Segment by query type and set goals accordingly.
Display Ads Goal
Accept 60-65% bounce rate. Low-intent traffic driven by curiosity clicks will always bounce higher. Focus on cost per engaged session, not bounce rate alone.
Social Traffic Goal
Target 50-55% bounce rate. Social visitors have moderate intent. Focus on content that encourages sharing and secondary pageviews.
Use GA4 engagement rate metrics alongside bounce rate for a fuller picture. GA4 counts a session as engaged if it lasts more than 10 seconds, has a conversion event, or has 2+ pageviews. The inverse of engagement rate is bounce rate. Both tell the same story from different angles.
Ready to Fix Your Bounce Rate and Turn Visitors Into Customers?
We have helped 250+ brands reduce bounce rates, improve engagement, and convert more traffic into revenue. If you are serious about fixing the leaks in your funnel, let's talk.